First, the introduction of Metrics
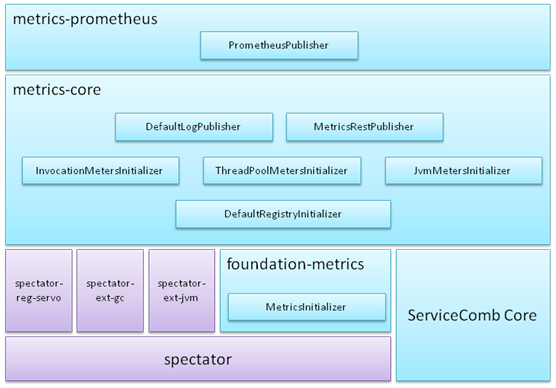
- Based on netflix spectator
- Foundation-metrics loads all MetricsInitializer implementations via the SPI mechanism. Implementers can use the getOrder in the MetricsInitializer to plan the execution order. The smaller the order number, the earlier it will be executed.
- Metrics-core implements 3 types of MetricsInitializer:
- DefaultRegistryInitializer: Instantiate and register spectator-reg-servo, set a smaller order, and ensure that it is executed before the following two types of MetricsInitializer
- Meters Initializer: Statistics of data such as TPS, delay, thread pool, jvm resources, etc.
- Publisher: Output statistics, built-in log output, and output via RESTful interface
- Metrics-prometheus provides the ability to interface with prometheus
Second, how to use.
1.Maven dependence.
<dependency>
  <groupId>org.apache.servicecomb</groupId>
  <artifactId>metrics-core</artifactId>
</dependency>
If integrate with prometheus, also need to add dependencies.
<dependency>
  <groupId>org.apache.servicecomb</groupId>
  <artifactId>metrics-prometheus</artifactId>
</dependency>
Note: Please change the version field to the actual version number; if the version number has been declared in the dependencyManagement, then you do not have to write the version number here
2. Configuration instructions
| Configuration Item | Default | Meaning |
|---|---|---|
| servicecomb.metrics.window_time | 60000 | Statistical period, in milliseconds TPS, delay, etc. Periodic data, updated once per cycle, the value obtained in the cycle, actually the value of the previous cycle |
| servicecomb.metrics .invocation.latencyDistribution |
The latency distribution time period definition in milliseconds for example:0,1,10,100,1000 indicates that the following latency scopes are defined: [0, 1),[1, 10),[10, 100),[100, 1000),[1000, ) |
|
| servicecomb.metrics .Consumer.invocation.slow.enabled |
false | Whether to enable slow call detection on the Consumer side Level 4 priority definitions can be supported by adding the suffix .${service}.${schema}.${operation} |
| servicecomb.metrics .Consumer.invocation.slow.msTime |
1000 | If the latency exceeds the configured value, the log will be output immediately, and the time consumption information of the stage called this time will be recorded. Level 4 priority definitions can be supported by adding the suffix .${service}.${schema}.${operation} |
| servicecomb.metrics .Provider.invocation.slow.enabled |
false | Whether to enable slow call detection on the Provider side Level 4 priority definitions can be supported by adding the suffix .${service}.${schema}.${operation} |
| servicecomb.metrics .Provider.invocation.slow.msTime |
1000 | If the latency exceeds the configured value, the log will be output immediately, and the time consumption information of the stage called this time will be recorded. Level 4 priority definitions can be supported by adding the suffix .${service}.${schema}.${operation} |
| servicecomb.metrics .prometheus.address |
0.0.0.0:9696 | prometheus listen address |
| servicecomb.metrics.publisher.defaultLog .enabled |
false | Whether to output the default statistics log |
| servicecomb.metrics.publisher.defaultLog .endpoints.client.detail.enabled |
false | Whether to output each client endpoint statistics log, because it is related to the target ip:port number, there may be a lot of data, so the default is not output |
3. Slow call detection
After slow call detection is enabled, if there is a slow call, the corresponding log will be output immediately:
2019-04-02 23:01:09,103\[WARN]\[pool-7-thread-74]\[5ca37935c00ff2c7-350076] - slow(40 ms) invocation, CONSUMER highway perf1.impl.syncQuery
  http method: GET
  url        : /v1/syncQuery/{id}/
  server     : highway://192.168.0.152:7070?login=true
  status code: 200
  total      : 50.760 ms
    prepare                : 0.0 ms
    handlers request       : 0.0 ms
    client filters request : 0.0 ms
    send request           : 0.5 ms
    get connection         : 0.0 ms
    write to buf           : 0.5 ms
    wait response          : 50.727 ms
    wake consumer          : 0.23 ms
    client filters response: 0.2 ms
    handlers response      : 0.0 ms (SlowInvocationLogger.java:121)
Where 5ca37935c00ff2c7-350076 is the structure of ${traceId}-${invocationId}, referenced by %marker in the output format of log4j2 or logback
4. Access via RESTful
As long as the microservices open the rest port, use a browser to access http://ip:port/metrics. will get json data in the following format:
{
  "servicecomb.vertx.endpoints(address=192.168.0.124:7070,statistic=connectCount,type=client)": 0.0,
  "servicecomb.vertx.endpoints(address=192.168.0.124:7070,statistic=disconnectCount,type=client)": 0.0,
  "servicecomb.vertx.endpoints(address=192.168.0.124:7070,statistic=connections,type=client)": 1.0,
  "servicecomb.vertx.endpoints(address=192.168.0.124:7070,statistic=bytesRead,type=client)": 508011.0,
  "servicecomb.vertx.endpoints(address=192.168.0.124:7070,statistic=bytesWritten,type=client)": 542163.0,
  "servicecomb.vertx.endpoints(address=192.168.0.124:7070,statistic=queueCount,type=client)": 0.0,

  "servicecomb.vertx.endpoints(address=0.0.0.0:7070,statistic=connectCount,type=server)": 0.0,
  "servicecomb.vertx.endpoints(address=0.0.0.0:7070,statistic=disconnectCount,type=server)": 0.0,
  "servicecomb.vertx.endpoints(address=0.0.0.0:7070,statistic=connections,type=server)": 1.0,
  "servicecomb.vertx.endpoints(address=0.0.0.0:7070,statistic=bytesRead,type=server)": 542163.0,
  "servicecomb.vertx.endpoints(address=0.0.0.0:7070,statistic=bytesWritten,type=server)": 508011.0,
  "servicecomb.vertx.endpoints(address=0.0.0.0:7070,statistic=rejectByConnectionLimit,type=server)": 0.0,
  "servicecomb.vertx.endpoints(address=localhost:8080,statistic=connectCount,type=server)": 0.0,
  "servicecomb.vertx.endpoints(address=localhost:8080,statistic=disconnectCount,type=server)": 0.0,
  "servicecomb.vertx.endpoints(address=localhost:8080,statistic=connections,type=server)": 0.0,
  "servicecomb.vertx.endpoints(address=localhost:8080,statistic=bytesRead,type=server)": 0.0,
  "servicecomb.vertx.endpoints(address=localhost:8080,statistic=bytesWritten,type=server)": 0.0,
  "servicecomb.vertx.endpoints(address=localhost:8080,statistic=rejectByConnectionLimit,type=server)": 0.0,

  "threadpool.completedTaskCount(id=cse.executor.groupThreadPool-group0)": 4320.0,
  "threadpool.rejectedCount(id=cse.executor.groupThreadPool-group0)": 0.0,
  "threadpool.taskCount(id=cse.executor.groupThreadPool-group0)": 4320.0,
  "threadpool.currentThreadsBusy(id=cse.executor.groupThreadPool-group0)": 0.0,
  "threadpool.poolSize(id=cse.executor.groupThreadPool-group0)": 4.0,
  "threadpool.maxThreads(id=cse.executor.groupThreadPool-group0)": 10.0,
  "threadpool.queueSize(id=cse.executor.groupThreadPool-group0)": 0.0,
  "threadpool.corePoolSize(id=cse.executor.groupThreadPool-group0)": 4.0,

  "servicecomb.invocation(operation=perf1.impl.syncQuery,role=CONSUMER,scope=[0,1),status=200,transport=highway,type=latencyDistribution)": 4269.0,
  "servicecomb.invocation(operation=perf1.impl.syncQuery,role=CONSUMER,scope=[1,3),status=200,transport=highway,type=latencyDistribution)": 0.0,
  "servicecomb.invocation(operation=perf1.impl.syncQuery,role=CONSUMER,scope=[3,10),status=200,transport=highway,type=latencyDistribution)": 0.0,
  "servicecomb.invocation(operation=perf1.impl.syncQuery,role=CONSUMER,scope=[10,100),status=200,transport=highway,type=latencyDistribution)": 0.0,
  "servicecomb.invocation(operation=perf1.impl.syncQuery,role=CONSUMER,scope=[100,),status=200,transport=highway,type=latencyDistribution)": 0.0,

  "servicecomb.invocation(operation=perf1.impl.syncQuery,role=PRODUCER,scope=[0,1),status=200,transport=highway,type=latencyDistribution)": 4269.0,
  "servicecomb.invocation(operation=perf1.impl.syncQuery,role=PRODUCER,scope=[1,3),status=200,transport=highway,type=latencyDistribution)": 0.0,
  "servicecomb.invocation(operation=perf1.impl.syncQuery,role=PRODUCER,scope=[3,10),status=200,transport=highway,type=latencyDistribution)": 0.0,
  "servicecomb.invocation(operation=perf1.impl.syncQuery,role=PRODUCER,scope=[10,100),status=200,transport=highway,type=latencyDistribution)": 0.0,
  "servicecomb.invocation(operation=perf1.impl.syncQuery,role=PRODUCER,scope=[100,),status=200,transport=highway,type=latencyDistribution)": 0.0,

  "servicecomb.invocation(operation=perf1.impl.syncQuery,role=PRODUCER,stage=total,statistic=count,status=200,transport=highway,type=stage)": 4269.0,
  "servicecomb.invocation(operation=perf1.impl.syncQuery,role=PRODUCER,stage=total,statistic=totalTime,status=200,transport=highway,type=stage)": 0.25269420000000004,
  "servicecomb.invocation(operation=perf1.impl.syncQuery,role=PRODUCER,stage=total,statistic=max,status=200,transport=highway,type=stage)": 2.7110000000000003E-4,
  "servicecomb.invocation(operation=perf1.impl.syncQuery,role=PRODUCER,stage=handlers_request,statistic=count,status=200,transport=highway,type=stage)": 4269.0,
  "servicecomb.invocation(operation=perf1.impl.syncQuery,role=PRODUCER,stage=handlers_request,statistic=totalTime,status=200,transport=highway,type=stage)": 0.0079627,
  "servicecomb.invocation(operation=perf1.impl.syncQuery,role=PRODUCER,stage=handlers_request,statistic=max,status=200,transport=highway,type=stage)": 1.74E-5,
  "servicecomb.invocation(operation=perf1.impl.syncQuery,role=PRODUCER,stage=handlers_response,statistic=count,status=200,transport=highway,type=stage)": 4269.0,
  "servicecomb.invocation(operation=perf1.impl.syncQuery,role=PRODUCER,stage=handlers_response,statistic=totalTime,status=200,transport=highway,type=stage)": 0.0060666,
  "servicecomb.invocation(operation=perf1.impl.syncQuery,role=PRODUCER,stage=handlers_response,statistic=max,status=200,transport=highway,type=stage)": 1.08E-5,
  "servicecomb.invocation(operation=perf1.impl.syncQuery,role=PRODUCER,stage=prepare,statistic=count,status=200,transport=highway,type=stage)": 4269.0,
  "servicecomb.invocation(operation=perf1.impl.syncQuery,role=PRODUCER,stage=prepare,statistic=totalTime,status=200,transport=highway,type=stage)": 0.016679600000000003,
  "servicecomb.invocation(operation=perf1.impl.syncQuery,role=PRODUCER,stage=prepare,statistic=max,status=200,transport=highway,type=stage)": 2.68E-5,
  "servicecomb.invocation(operation=perf1.impl.syncQuery,role=PRODUCER,stage=queue,statistic=count,status=200,transport=highway,type=stage)": 4269.0,
  "servicecomb.invocation(operation=perf1.impl.syncQuery,role=PRODUCER,stage=queue,statistic=totalTime,status=200,transport=highway,type=stage)": 0.08155480000000001,
  "servicecomb.invocation(operation=perf1.impl.syncQuery,role=PRODUCER,stage=queue,statistic=max,status=200,transport=highway,type=stage)": 2.1470000000000001E-4,
  "servicecomb.invocation(operation=perf1.impl.syncQuery,role=PRODUCER,stage=execution,statistic=count,status=200,transport=highway,type=stage)": 4269.0,
  "servicecomb.invocation(operation=perf1.impl.syncQuery,role=PRODUCER,stage=execution,statistic=totalTime,status=200,transport=highway,type=stage)": 0.0098285,
  "servicecomb.invocation(operation=perf1.impl.syncQuery,role=PRODUCER,stage=execution,statistic=max,status=200,transport=highway,type=stage)": 4.3100000000000004E-5,
  "servicecomb.invocation(operation=perf1.impl.syncQuery,role=PRODUCER,stage=server_filters_request,statistic=count,status=200,transport=highway,type=stage)": 4269.0,
  "servicecomb.invocation(operation=perf1.impl.syncQuery,role=PRODUCER,stage=server_filters_request,statistic=totalTime,status=200,transport=highway,type=stage)": 0.0170669,
  "servicecomb.invocation(operation=perf1.impl.syncQuery,role=PRODUCER,stage=server_filters_request,statistic=max,status=200,transport=highway,type=stage)": 3.6400000000000004E-5,
  "servicecomb.invocation(operation=perf1.impl.syncQuery,role=PRODUCER,stage=server_filters_response,statistic=count,status=200,transport=highway,type=stage)": 4269.0,
  "servicecomb.invocation(operation=perf1.impl.syncQuery,role=PRODUCER,stage=server_filters_response,statistic=totalTime,status=200,transport=highway,type=stage)": 0.0196985,
  "servicecomb.invocation(operation=perf1.impl.syncQuery,role=PRODUCER,stage=server_filters_response,statistic=max,status=200,transport=highway,type=stage)": 4.8100000000000004E-5,
  "servicecomb.invocation(operation=perf1.impl.syncQuery,role=PRODUCER,stage=producer_send_response,statistic=count,status=200,transport=highway,type=stage)": 4269.0,
  "servicecomb.invocation(operation=perf1.impl.syncQuery,role=PRODUCER,stage=producer_send_response,statistic=totalTime,status=200,transport=highway,type=stage)": 0.0880885,
  "servicecomb.invocation(operation=perf1.impl.syncQuery,role=PRODUCER,stage=producer_send_response,statistic=max,status=200,transport=highway,type=stage)": 1.049E-4,
  "servicecomb.invocation(operation=perf1.impl.syncQuery,role=CONSUMER,stage=total,statistic=count,status=200,transport=highway,type=stage)": 4269.0,
  "servicecomb.invocation(operation=perf1.impl.syncQuery,role=CONSUMER,stage=total,statistic=totalTime,status=200,transport=highway,type=stage)": 0.9796976000000001,
  "servicecomb.invocation(operation=perf1.impl.syncQuery,role=CONSUMER,stage=total,statistic=max,status=200,transport=highway,type=stage)": 6.720000000000001E-4,
  "servicecomb.invocation(operation=perf1.impl.syncQuery,role=CONSUMER,stage=handlers_request,statistic=count,status=200,transport=highway,type=stage)": 4269.0,
  "servicecomb.invocation(operation=perf1.impl.syncQuery,role=CONSUMER,stage=handlers_request,statistic=totalTime,status=200,transport=highway,type=stage)": 0.012601500000000002,
  "servicecomb.invocation(operation=perf1.impl.syncQuery,role=CONSUMER,stage=handlers_request,statistic=max,status=200,transport=highway,type=stage)": 3.5000000000000004E-5,
  "servicecomb.invocation(operation=perf1.impl.syncQuery,role=CONSUMER,stage=handlers_response,statistic=count,status=200,transport=highway,type=stage)": 4269.0,
  "servicecomb.invocation(operation=perf1.impl.syncQuery,role=CONSUMER,stage=handlers_response,statistic=totalTime,status=200,transport=highway,type=stage)": 0.0066785,
  "servicecomb.invocation(operation=perf1.impl.syncQuery,role=CONSUMER,stage=handlers_response,statistic=max,status=200,transport=highway,type=stage)": 3.21E-5,
  "servicecomb.invocation(operation=perf1.impl.syncQuery,role=CONSUMER,stage=prepare,statistic=count,status=200,transport=highway,type=stage)": 4269.0,
  "servicecomb.invocation(operation=perf1.impl.syncQuery,role=CONSUMER,stage=prepare,statistic=totalTime,status=200,transport=highway,type=stage)": 0.010363800000000001,
  "servicecomb.invocation(operation=perf1.impl.syncQuery,role=CONSUMER,stage=prepare,statistic=max,status=200,transport=highway,type=stage)": 2.85E-5,
  "servicecomb.invocation(operation=perf1.impl.syncQuery,role=CONSUMER,stage=client_filters_request,statistic=count,status=200,transport=highway,type=stage)": 4269.0,
  "servicecomb.invocation(operation=perf1.impl.syncQuery,role=CONSUMER,stage=client_filters_request,statistic=totalTime,status=200,transport=highway,type=stage)": 0.0060282,
  "servicecomb.invocation(operation=perf1.impl.syncQuery,role=CONSUMER,stage=client_filters_request,statistic=max,status=200,transport=highway,type=stage)": 9.2E-6,
  "servicecomb.invocation(operation=perf1.impl.syncQuery,role=CONSUMER,stage=consumer_send_request,statistic=count,status=200,transport=highway,type=stage)": 4269.0,
  "servicecomb.invocation(operation=perf1.impl.syncQuery,role=CONSUMER,stage=consumer_send_request,statistic=totalTime,status=200,transport=highway,type=stage)": 0.099984,
  "servicecomb.invocation(operation=perf1.impl.syncQuery,role=CONSUMER,stage=consumer_send_request,statistic=max,status=200,transport=highway,type=stage)": 1.1740000000000001E-4,
  "servicecomb.invocation(operation=perf1.impl.syncQuery,role=CONSUMER,stage=consumer_get_connection,statistic=count,status=200,transport=highway,type=stage)": 4269.0,
  "servicecomb.invocation(operation=perf1.impl.syncQuery,role=CONSUMER,stage=consumer_get_connection,statistic=totalTime,status=200,transport=highway,type=stage)": 0.006916800000000001,
  "servicecomb.invocation(operation=perf1.impl.syncQuery,role=CONSUMER,stage=consumer_get_connection,statistic=max,status=200,transport=highway,type=stage)": 5.83E-5,
  "servicecomb.invocation(operation=perf1.impl.syncQuery,role=CONSUMER,stage=consumer_write_to_buf,statistic=count,status=200,transport=highway,type=stage)": 4269.0,
  "servicecomb.invocation(operation=perf1.impl.syncQuery,role=CONSUMER,stage=consumer_write_to_buf,statistic=totalTime,status=200,transport=highway,type=stage)": 0.0930672,
  "servicecomb.invocation(operation=perf1.impl.syncQuery,role=CONSUMER,stage=consumer_write_to_buf,statistic=max,status=200,transport=highway,type=stage)": 1.1580000000000001E-4,
  "servicecomb.invocation(operation=perf1.impl.syncQuery,role=CONSUMER,stage=consumer_wait_response,statistic=count,status=200,transport=highway,type=stage)": 4269.0,
  "servicecomb.invocation(operation=perf1.impl.syncQuery,role=CONSUMER,stage=consumer_wait_response,statistic=totalTime,status=200,transport=highway,type=stage)": 0.7654931,
  "servicecomb.invocation(operation=perf1.impl.syncQuery,role=CONSUMER,stage=consumer_wait_response,statistic=max,status=200,transport=highway,type=stage)": 5.547E-4,
  "servicecomb.invocation(operation=perf1.impl.syncQuery,role=CONSUMER,stage=consumer_wake_consumer,statistic=count,status=200,transport=highway,type=stage)": 4269.0,
  "servicecomb.invocation(operation=perf1.impl.syncQuery,role=CONSUMER,stage=consumer_wake_consumer,statistic=totalTime,status=200,transport=highway,type=stage)": 0.0502085,
  "servicecomb.invocation(operation=perf1.impl.syncQuery,role=CONSUMER,stage=consumer_wake_consumer,statistic=max,status=200,transport=highway,type=stage)": 3.7370000000000003E-4,
  "servicecomb.invocation(operation=perf1.impl.syncQuery,role=CONSUMER,stage=client_filters_response,statistic=count,status=200,transport=highway,type=stage)": 4269.0,
  "servicecomb.invocation(operation=perf1.impl.syncQuery,role=CONSUMER,stage=client_filters_response,statistic=totalTime,status=200,transport=highway,type=stage)": 0.0227188,
  "servicecomb.invocation(operation=perf1.impl.syncQuery,role=CONSUMER,stage=client_filters_response,statistic=max,status=200,transport=highway,type=stage)": 4.0E-5
}
Third, the summary of statistical items
1. CPU
| Name | Tag keys | Tag values | Description |
|---|---|---|---|
| os | type | cpu | System CPU usage in the current period, Solaris mode |
| processCpu | Microservice process CPU usage in the current period, IRIX mode processCpu divided by cpu is equal to the number of system CPUs |
2. NET
| Name | Tag keys | Tag values | Description |
|---|---|---|---|
| os | type | net | |
| statistic | send | Average number of bytes sent per second during the current period (Bps) | |
| receive | Average number of bytes received per second during the current period (Bps) | ||
| sendPackets | Average number of packets sent per second (pps) during the current period | ||
| receivePackets | Average number of packets received per second (pps) during the current period | ||
| interface | net dev name |
3. vertx client endpoints
| Name | Tag keys | Tag values | Description |
|---|---|---|---|
| servicecomb .vertx .endpoints |
type | client | |
| address | ${ip}:${port} | server ip:port | |
| statistic | connectCount | Number of connections have been initiated in the current period | |
| disconnectCount | Number of disconnections in the current period | ||
| queueCount | The number of requests in the http connection pool that are waiting to get a connection | ||
| connections | Current connection number | ||
| bytesRead | Average number of bytes received per second during the current period (Bps) Business layer statistics, relative to the data obtained from the network card, the data here does not include the size of the header For http messages, does not include http header size |
||
| bytesWritten | Average number of bytes sent per second during the current period (Bps) Business layer statistics, relative to the data obtained from the network card, the data here does not include the size of the header For http messages, does not include http header size |
4. vertx server endpoints
| Name | Tag keys | Tag values | Description |
|---|---|---|---|
| servicecomb .vertx .endpoints |
type | server | |
| address | ${ip}:${port} | listen ip:port | |
| statistic | connectCount | Number of connections are connected in the current period | |
| disconnectCount | Number of disconnections in the current period | ||
| rejectByConnectionLimit | Number of active disconnections due to exceeding the number of connections in the current period | ||
| connections | Current connection number | ||
| bytesRead | Average number of bytes sent per second during the current period (Bps) Business layer statistics, relative to the data obtained from the network card, the data here does not include the size of the header For http messages, does not include http header size |
||
| bytesWritten | Average number of bytes received per second during the current period (Bps) Business layer statistics, relative to the data obtained from the network card, the data here does not include the size of the header For http messages, does not include http header size |
5. Invocation latency distribution
| Name | Tag keys | Tag values | Description |
|---|---|---|---|
| servicecomb .invocation |
role | CONSUMER、PRODUCER、EDGE | Is the CONSUMER, PRODUCER or EDGE side statistics |
| operation | ${microserviceName} .${schemaId} .${operationName} |
Method name called | |
| transport | highway or rest | On which transmission channel the call is made | |
| status | http status code | ||
| type | latencyDistribution | invocation latency distribution | |
| scope | [${min}, ${max}) | The call count in the current period that latency is greater than or equal to min, less than max [${min},) means max is infinite |
6. invocation consumer stage latency
| Name | Tag keys | Tag values | Description |
|---|---|---|---|
| servicecomb .invocation |
role | CONSUMER | Statistics on the CONSUMER side |
| operation | ${microserviceName} .${schemaId} .${operationName} |
Method name called | |
| transport | highway or rest | On which transmission channel the call is made | |
| status | http status code | ||
| type | stage | stage latency | |
| stage | total | The whole process | |
| prepare | |||
| handlers_request | Handler chain request process | ||
| client_filters_request | Http client filter chain request process Only the rest transport has this stage. |
||
| consumer_send_request | Send request stage, including consumer_get_connection and consumer_write_to_buf | ||
| consumer_get_connection | Get a connection from the connection pool | ||
| consumer_write_to_buf | Write data to the network buffer | ||
| consumer_wait_response | Waiting for the server to answer | ||
| consumer_wake_consumer | In the synchronization process, after receiving the response, it takes time from waking up the waiting thread to waiting for the thread to start processing the response. | ||
| client_filters_response | Http client filter chain response process | ||
| handlers_response | Handler chain response process | ||
| statistic | count | Average number of calls per second (TPS) Count=Number of calls/period in the statistical period (seconds) |
|
| totalTime | In seconds totalTime=The total duration of the call in the current period (seconds) totalTime divided by count to get the average latency |
||
| max | In seconds Maximum latency in the current period |
7. invocation producer stage latency
| Name | Tag keys | Tag values | Description |
|---|---|---|---|
| servicecomb .invocation |
role | PRODUCER | Statistics on the PRODUCER side |
| operation | ${microserviceName} .${schemaId} .${operationName} |
Method name called | |
| transport | highway or rest | On which transmission channel the call is made | |
| status | http status code | ||
| type | stage | stage latency | |
| stage | total | The whole process | |
| prepare | |||
| queue | Meaning only when using a thread pool Indicates the length of time the call is queued in the thread pool |
||
| server_filters_request | Http server filter chain request process Only the rest transport has this stage. |
||
| handlers_request | Handler chain request process | ||
| execution | Business method | ||
| handlers_response | Handler chain response process | ||
| server_filters_response | Http server filter chain response process | ||
| producer_send_response | Send a response | ||
| statistic | count | Average number of calls per second (TPS) Count=Number of calls/period in the statistical period (seconds) |
|
| totalTime | In seconds totalTime=The total duration of the call in the current period (seconds) AverageTime divided by count to get the average latency |
||
| max | In seconds Maximum latency in the current period |
8. invocation edge stage latency
| Name | Tag keys | Tag values | Description |
|---|---|---|---|
| servicecomb .invocation |
role | EDGE | EDGE statistics |
| operation | ${microserviceName} .${schemaId} .${operationName} |
Method name called | |
| transport | highway or rest | On which transmission channel the call is made | |
| status | http status code | ||
| type | stage | stage latency | |
| stage | total | The whole process | |
| prepare | |||
| queue | Meaning only when using a thread pool Indicates the length of time the call is queued in the thread pool |
||
| server_filters_request | Http server filter chain request process | ||
| handlers_request | Handler chain request process | ||
| client_filters_request | Http client filter chain request process | ||
| consumer_send_request | Send request stage, including consumer_get_connection and consumer_write_to_buf | ||
| consumer_get_connection | Get a connection from the connection pool | ||
| consumer_write_to_buf | Write data to the network buffer | ||
| consumer_wait_response | Waiting for the server to answer | ||
| consumer_wake_consumer | In the synchronization process, after receiving the response, it takes time from waking up the waiting thread to waiting for the thread to start processing the response. | ||
| client_filters_response | Http client filter chain response process | ||
| handlers_response | Handler chain response process | ||
| server_filters_response | Http server filter chain response process | ||
| producer_send_response | Send a response | ||
| statistic | count | Average number of calls per second (TPS) Count=Number of calls/period in the statistical period (seconds) |
|
| totalTime | In seconds totalTime=The total duration of the call in the current period (seconds) AverageTime divided by count to get the average latency |
||
| max | In seconds Maximum latency in the current period |
9. threadpool
| Name | Tag keys | Tag values | Description |
|---|---|---|---|
| threadpool.corePoolSize | id | ${threadPoolName} | Minimum number of threads |
| threadpool.maxThreads | Maximum number of threads allowed | ||
| threadpool.poolSize | Current actual number of threads | ||
| threadpool.currentThreadsBusy | The current number of active threads, which is the number of tasks currently being executed | ||
| threadpool.queueSize | Number of tasks currently queued | ||
| threadpool.rejectedCount | The average number of tasks rejected per second during the current period | ||
| threadpool.taskCount | Average number of tasks submitted per second during the statistical period taskCount=(completed + queue + active)/period (seconds) |
||
| threadpool.completedTaskCount | The average number of tasks completed per second during the statistical period completedTaskCount=completed/period (seconds) |
Fourth, business customization
Because ServiceComb has initialized the registry's registry, the business no longer has to create a registry.
Implement the MetricsInitializer interface, define the business-level Meters, or implement a custom Publisher, and then declare your implementation through the SPI mechanism.
1.Meters:
Creating Meters capabilities is provided by spectator, available in the [netflix spectator] (https://github.com/Netflix/spectator) documentation
2.Publisher:
Periodically output scenarios, such as log scenarios, subscribe to org.apache.servicecomb.foundation.metrics.PolledEvent via eventBus, PolledEvent.getMeters() is the statistical result of this cycle. Non-periodic output scenarios, such as access through the RESTful interface, the statistical results of this cycle can be obtained through globalRegistry.iterator()